Transactions/Financial Reports
Credit Transaction Report
Description: This report will show every credit transaction that has taken place at a location.
- Transdate: Local time of when the transaction took place.
- Location: Location of the kiosk.
- Transid: Unique identifier number for the transaction.
- Consumer Name: This will show the consumer's name if they swiped their card to add funds to their account.
- Type: Charge or Credit:
- Charges are walk-up credit purchases.
- Credit is when funds are added to an account using a credit card.
- CC Type: This will show what type of card was used, e.g., Visa, MasterCard, American Express, etc.
- PAN: The last four digits of the card that was used.
- Amount: Total amount of the transaction.
- Void: This will show if the transaction was voided(ReadyTouch feature only)
- Reason: This will display the reason for the void. (ReadyTouch feature only)
- HostRef: This allows us to see a reference for the transaction to see who the processor is (used by the Support team)
Daily Sales Summary
Description: This report will show your sales for each day within the date range you have chosen.
- Date: This shows each day listed one by one.
- Location: Kiosk location.
- Transactions: How many transactions occurred on that date.
- Item Count: How many items were sold on that date.
- Sales: Total amount in sales for that date (does not include tax)
- Taxes: How much tax was collected for that date.
- Deposit: How many deposits were collected on that date. (This only shows if you have deposits set up for your products.)
- Discount: How many discounts were applied to products sold if you are running a promotion.
- Total Sales: Combines Sales, Taxes, Deposits, and Discounts to calculate a grand total for that day.
- Consumer Count: How many transactions were completed using a GMA account for that day.
Product Sales Report
Description: This report will show you how much of each product you are selling to determine what products are selling better than others.
- Product: Name of product sold.
- Scancode: UPC of the product.
- UserKey: This is only needed if using the Lightspeed integration.
- Cat 1-3: Shows the categories of the product.
- Qty Sold: How much of that product you have sold within the selected date range.
- Total Price: Qty Sold x Price of one unit.
- Case Count: If picking that product by the case, this will show how many individual items are in a case.
Sold Detail Report
Description: This report will show every item that was sold from your market.

- Location: The location where the transaction occurred.
- Device: Serial number of the kiosk where the item was sold.
- Transdate: Local time the transaction was completed by the consumer.
- Date Created: Server time. If the server is in a different time zone than the kiosk, it will record the time of the Server in this field.
- Product Name: Name of the product that was sold.
- Scancode: The UPC of the product.
- UserKey: This is only needed if you use the LightSpeed Integration.
- Customer: The unique identifier of the consumer who made the purchase. This field will only be populated if a consumer used a GMA account to make a purchase. It will not be populated for anonymous transactions.
- Pay Method: The method that the consumer used to pay for the purchase. Possible payment methods include Loyalty, Credit, and Account.
- Cat 1-3: Categories linked to that product.
- Price: The price of the product, not including tax, deposits, or discounts.
- Tax 1-4: The amount of tax that was applied to the product sale. Deposit: The deposit amount for the product.
(This only shows if you have a deposit tied to that product.) - Total Price: The total cost of the product, which is the sum of the amount, tax 1, tax 2, and the deposit.
- Discount: The discount amount that was applied to the product sale due to any promotions that were in effect.
- Cost: The amount you paid for the product. (This only shows if you have entered the product cost for that product.)
- Margin: The difference between the price and the cost of the product.
- Loyalty: How many points were awarded for buying that product if the Loyalty Rewards Program is activated.
Sold Item COGS
COGS = Cost of Goods
Description: This report is used to see your profit margins for the items sold.
Important Note: A cost must be associated to your products in order for the system to calculate out the profits

- Location Name: Kiosk location.
- Product Name: Name of the product sold.
- Scancode: UPC of the product.
- Product Category: Displays the first category of the product.
- Units Sold: Total number of that product sold within the date range selected.
- Cost Per Unit: Goes by the Cost field of the product and displays its cost.
- Total COGS: Total cost of the product that was sold
(Cost Per Unit x Units Sold). - Revenue: How much total revenue was generated from that product.
- Profit: How much money you made on that product.
Transaction Canned Report
Description: This report will compare account transactions to credit card transactions. You can also see your total revenue for the date range chosen.
- Location: Kiosk location.
- Transactions: The number of total transactions that occurred in a specific date range.
- Sales Units: The total number of products sold in a specific date range.
- Sales $: The total revenue generated in a specific date range.
- Units per Transaction*: An average of how many products are sold in each transaction.
- Sales per Transaction*: The average transaction cost.
- Sales per Unit*: Average dollar amount of individual products in a transaction.
- Account Transactions: The number of purchases that were completed using an Account.
- Account Amount: How much revenue was generated by Account transactions only.
- Account %: The total percentage of transactions completed with accounts.
- Credit Transactions: Total number of transactions completed with a credit card.
- Credit Amount: Total revenue generated by credit cards only.
- Credit %: The total percentage of transactions completed with credit cards.
- Credit Comparison: This shows a comparison between the average sales per transaction when credit is used versus the average sales per transaction when an account is used.
- Example: A value of 20% indicates that when a credit card is used to make a purchase, on average, the total amount spent is 20% greater than if that customer was to make a purchase using an account. If the average sales amount is enough to cover credit card fees, it could be more profitable for the operator to allow customers to keep using their credit cards, rather than encouraging the use of GMA accounts.
Sales Analysis Report
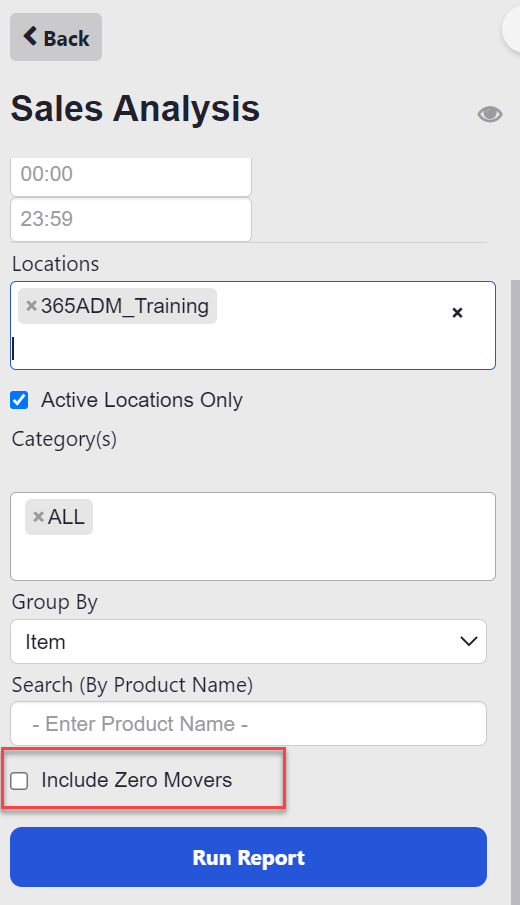
Description: The sales analysis report will show how each individual product is performing. You can click on the sold column header to filter the data to easily see what the best selling products are.
This report can also be filtered by category and you can choose an option to include zero movers which will also then display any products that were not sold during the date range chosen. (See image below)
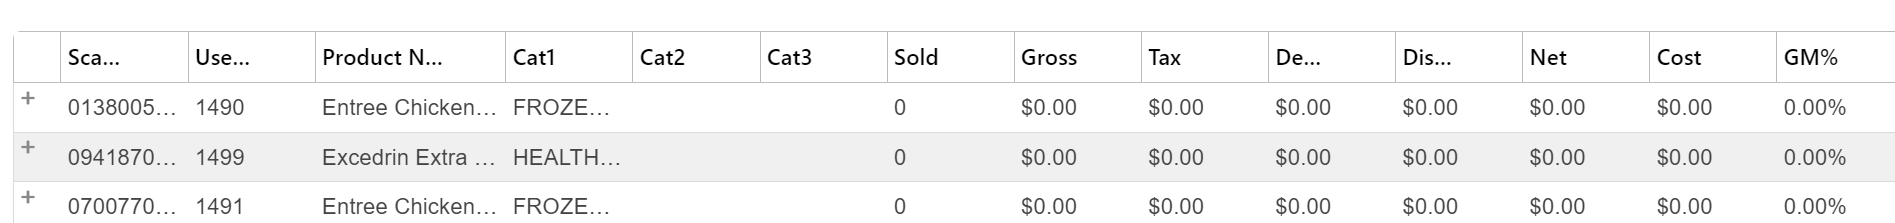
- Scancode: UPC number on product
- UserKey: Displays what you have typed in for the Userkey for that product
- Note: Userkey is required if using the Lightspeed integration. If not using Lightspeed then this field can either be left blank or be used for any other purpose that may be beneficial to you for reporting data.
- Product Name: Name you have given to the product
- Cat 1-3: Will display the categories you have associated to the product
- Sold: Total number of that product sold within the date range that was chosen when running the report.
- Note: If multiple locations are chosen at the same time when running the report then the sold column will represent total amount of that product sold amongst the locations that were chosen. You can click on the + sign on the left next to the scancode field to see each location product sales individually.
- Gross: The gross amount you have collected on that product within the date range chosen.
- Tax: How much tax was collected on that product within the date range chosen
- Deposit: Will show bottle deposits collected on a product if a deposit rate has been attributed to the product.
- Net: Will show your net amount you have collected within the date range chosen.
- Cost: Will show the total cost of each product sold within the date range chosen
- Note: A cost must be associated to the product in order for this info to show. (Costs can be added within the Global Products page under the Product drop down tab)
- GM%: Will show Gross Margin Percentage for each product
- Note: A cost must be associated to the product to calculate this information.
International Distributor Report
Description: Finance uses a series of reports from ADM and other outside report services to generate a new report that is used to pay and charge International Distributors. This report will make this process quicker and more reliable.
- Distributor: The name of the associated Distributor. This field is found on the Location Summary page as “Distributor”.
- Bill To: The “Sage Number 1” number for the associated Org, found on the Org Summary page.
- Operator: The Name of the associated Operator.
- Location Name: The Name of the associated Location.
- Serial Number: The Device Name (such as VSH600000).
- Go-Live Date: The associated go-live date for the particular device.
- MKL: This value will need some technical insight. We want to show if the associated Location for the device has multiple devices deployed there. For example, if Location A has Device 1 and Device 2, it will qualify as an MKL. If Location B has Device 1, it will not qualify as an MKL. We might be able to do something where if the Location Name and Org Name appear more than once, we display the output. This field would have values of MKL and a Null.
- Sales: The Total Sales value associated with the Device, for the selected timeframe. Total Sales includes the base price, taxes (VAT), deposits, and discounts. If possible, show the currency symbol that is associated with the Org level.
Inventory Reports
Financial Canned Report
Description: This report is best used to see how much product you are missing due to possible theft or spoilage.
Important Note: You must have costs associated to your products in order for this report to work correctly. Whenever ADM detects that a product is missing during an inventory or if a product is removed due to spoilage it takes the total costs of those products and puts the information within this report.

- Location: Kiosk location.
- Sales: Total revenue for the selected date range.
- Product Cost: Total amount spent on products based on what was sold for the given date range.
This only shows if you have entered the product cost for your products. - Product Cost %: Shows the percentage of your total revenue going towards buying products.
- Spoil/Damaged $: A summation of the total COST of all products removed from a location due to a reason code of Damage, Damaged, Spoil, Spoiled, Spoilage, Waste, Wasted, Stale, or Stales.
- Spoil/Damaged %: This field displays the proportion of the COST of spoiled or damaged goods to total revenues, calculated as Spoil/Damaged / Sales $.
- Over $: The COST of products added to a location during inventory adjustment. This value is the additional dollar amount of products over what should be added during regular market stocking. This value has a system-generated reason code of Physical Adjustment.
- Over %: This field displays the proportion of the COST of over products added to the market compared to total revenues, calculated as Over $ / Sales $.
- (Short) $: The COST of products removed from a location during inventory adjustment. Short will include the Physical Adjustments reason code, which is system generated during inventories. It will also include the additional reason codes of Shrink, Shrinkage, Short, Shortage, and Theft.
- (Short) %: This field displays the proportion of the COST of short products removed from the market compared to total revenues, calculated as Short $ / Sales $.
- Gross Margin %: This field shows the percentage of revenues that remain after taking the cost of goods sold, spoilage, and short inventory into consideration. It is calculated as 100% - Product Cost % - Spoil/Damaged % - Short %.
- Last year/year: The value of Sales $ from the selected date range compared to the value of Sales $ of the previous year’s date range. If no data is available, or if the data is partial for the previous year, this field would be blank or show a partial result.
Example: Sales $ for 2017 is $1,000 and Sales $ for 2016 is $500, so Last Year/Year is $500. A negative value for Last Year/Year indicates that sales for the current date range are less than sales for the previous year’s date range. - Last year/year %: A proportion calculated as the Sales $ from the selected date range divided by the Sales $ of the previous year’s date range. If no data is available, or if the data is partial for the previous year, this field would be blank or show a partial result. A value over 100% indicates that Sales $ in the current date range has exceeded the Sales $ in the previous year’s date range.
Product Canned Report
Description: This report will show you the individual items that have been removed from your market due to spoilage or theft.
Important Note: You must have costs associated to your products in order for this report to work correctly. Whenever ADM detects that a product is missing during an inventory or if a product is removed due to spoilage it takes the total costs of those products and puts the information within this report.

- Product: Product name.
- Sales Units: Shows how much product has been sold within the date range chosen.
- Sales: Total revenue of the product sold.
- Avg Sell Price: Sales/Sales Units will give you the average sell price.
- Spoil/Damaged Units: How much of that product has been removed due to spoilage.
- Spoil/Damage%: Spoiled Units/Sales Units will give you the percent of spoilage.
- Shrink Units: Number of units that are missing when inventory is taken.
- Shrink%: Shrink Units/Sales Units will give you the shrink percentage.
- Min: What your min level is set to for that product.
- Max: What your max is set to for that product.
Delete Summary
Description: This report will display all items that have been removed from a market.
- Date/Time: Shows when the product was removed.
- Location: The location where the product was removed.
- Scancode: UPC of the product.
- UserKey: This is only needed for Lightspeed integration.
- Product: Name of product that was removed.
- Cat 1-3: Shows the categories linked to the product.
- # Del: How many of that product was removed.
- Total Cost: # Del x Cost of an individual product.
- Total Price: # Del x Price of an individual product.
- Reason: Shows the reason why the product was removed.
- User: Shows who was taking inventory when that product was removed.
Inventory Adjustment Detail
Description: This report will show you all product movements, including sales or adding/removing products.
- Location: Kiosk location.
- Product: Name of product that was moved.
- Scancode: UPC of the product.
- Userkey: This is only needed for Lightspeed integration.
- Category: First category the product has linked to it.
- Movement Type: Sale, Add or Remove.
- Reason: Shows the specific reason code associated with adding or removing a product if there was one.
- Quantity: Total amount of product sold, added, or removed.
- Price: The price of one unit.
- Cost: The cost of one unit.
- User: This shows who added or removed the product.
- Date/Time: Time that the product was added or removed.
Inventory Totals
Description: This report shows your total inventory levels among your entire company.
- Item: Name of the product.
- Inventory Count: Total amount of that product you have on-hand.
- Product Cost: Total cost of that product (Inventory Count x Cost of a single unit).
Inventory Value Summary
Description: This report can be used to see your current on-hand quantity levels and the total cost and price of all your product that has yet to be sold.
- Location Name: Where the kiosk is located.
- Userkey: This is only needed for Lightspeed integration.
- Scancode: UPC of the product.
- Description: Description of the product.
- Cat 1-3: Categories linked to the product.
- Cost: Cost of one unit.
- Price: Price of one unit.
- Qty on Hand: Current on-hand levels.
- Min: What your Min level is currently set to.
- Max: What your Max level is currently set to.
- Cost Total: Cost of one unit x Qty on Hand.
- Price Total: Price of one unit x Qty on Hand.
- Sold in a Week: How much of that product you sold in one week.
- Total Sold: Total amount of that product sold from the time you started selling that product.
Other Reports
Entry Summary Report
Description: This report
- Date/Time:
- Location:
- Scancode:
- Userkey:
- Product:
- Cat1, Cat2, and Cat3:
- # Add:
- Total Cost:
- Total Price:
- Reason:
- User:
Cancel Report
Description: This report
- Location:
- Time Canceled:
- Screen:
- Trans Id:
- Items:
- Total:
- Customer:
- Name on CC:
- Last 4 of CC:
EFT: Cross Org: GMA Disbursement
Description: This report
- Org Name:
- Disbursement Date:
- Amount:
- Download File w/ Device Detail:
- Download File W/o Device Detail:
Inventory Variance
Description: This report
- Scancode:
- Product Description:
- Cat1:
- Start Date Qty:
- Adds:
- Removes:
- Sales:
- Expected:
- Variance:
- Unit Cost:
- Variance Cost:
- Last Inventory:
- On-Hand Inv:
- Inv Cost:
- Last Stockout:
UFS
Description:
This report shows the total amount of transactions, including cash transactions. It allows the operator to see the types of credit cards used by their customers.
This report has two
Cash Flow Details
- Payment Type:
- Payment Counts:
- Payment Amounts:
- Void Counts:
- Void Amounts:
- Credit Declined Counts:
- Credit Declined Amounts:
- Sales:
- Taxes:
- Totals:
Sales Time Details
- Time:
- Transactions:
- Sales:
- Discounts:
- Taxes:
- Sales incl. Tax:
Account Funding
Description: This report
You will need to input the relevant date and location(s), and may also include the time range. You are able to select Active Locations Only, if desired.
- Date:
- Location:
- Operator Credit:
- Consumer Credits:
- Kiosk Credit:
- Kiosk Cash:
- Remaining Account Balances:
- Account Sales:
- Credit Sales:
- Total Sales:
Account Funding Detail
Description: This report
- Location:
- Time:
- Consumer Id:
- Consumer Name:
- Amount:
- Method:
- Trans Id:
Cashout Log
Description: This report
- Date:
- Location:
- Staff:
- Total:
- $1 $2 $5 $10 $20 $50 $100:
Cash Audit
Description:
This report may only be run against one location at a time.
- Date:
- Location:
- Consumer:
- Total (+):
- Total (-):
- $1 $2 $5 $10 $20 $50 $100:
Promotion Analysis
Description:
This report can be grouped by Redeemed Promotions, Unredeemed Promotions, and All Promotions. It can also be filtered by City, Device, Location, Org, State, and Zip code.

- Promotion Name:
- Display Name:
- Type:
- Discount:
- Applied To:
- Reward Points:
- Redemptions:
- Amount:
- Timing:
- Start Date:
- End Date:
- Frequency:
- Status: